Rainbow Matrix AI
Elite Operator's Manual.
🌈 MTF Probability Engine · 💎 Elite Access
The most advanced multi-timeframe analysis engine available on the market for the private operator.
Philosophy: The Awakening of the Institutional Operator
From the same sleepless nights. From the same poorly timed entries. This system was forged out of the exact same pain you are probably feeling right now.
There is a statistic that no one tells you when you first start: 95% of people who venture into this market lose money. It's not bad luck. It's not a lack of intelligence. It is a system designed to do exactly that. We are sardines in an ocean full of sharks and whales. Our money doesn't disappear — it is transferred.
Over time, understanding something much bigger than charts and indicators becomes clear. The financial market is not just numbers — it is a theater. Institutional whales know exactly where retail stops are positioned. They build traps. They create false moves to trigger exits before going in the direction you predicted.
With over two and a half years of intensive development, hundreds of hours of testing in live markets, and the collaboration of the best AI agents available, the core market indicators were taken, applied simultaneously across 5 distinct and configurable timeframes, and through mathematical algorithms based on Fibonacci, log-normal statistics, and institutional gravitational physics, all 50 parameters were transformed into a single number: the Global Probability Score.
While ordinary trading bots react to the market, Rainbow Matrix AI anticipates it. While retail traders just see a screen, you see five temporal dimensions fused into a single probability signal.
Generic bots operate on fixed parameters, hardcoded for specific market conditions. When the volatility regime shifts — or when a "Black Swan" event strikes — the bot, unable to structurally adapt, often wipes out the user's account in a matter of hours.
Rainbow Matrix AI was forged from years of research and reverse-engineering institutional behavior. We didn't build a bot to trade for you; we built an analytical exoskeleton for your brain.
- Bots: React to the market with fixed, rigid parameters blind to context.
- Rainbow Matrix AI: Anticipates the market via real-time mathematical probability HUD with X-ray vision.
- Result: The human retains absolute control. You are no longer the prey. You are the predator.
Rainbow Matrix AI is not an ordinary indicator — it is a quantitative calculation engine built on three fundamental mathematical pillars:
- Fibonacci Sequence: Defines temporal parameters and weights of timeframes. The institutional market is built on this sequence — to understand it is to speak the language of the big players.
- Log-Normal Distribution: Unlike conventional Bollinger Bands (linear distribution), exhaustion zones are calculated using natural logarithms — capturing the geometric and asymmetric reality of price movements.
- Quantum HFT Volatility (GK + EWMA): Fuses Garman-Klass (capturing intra-candle violence of wicks and stop-hunts) with RiskMetrics EWMA (J.P. Morgan's standard for volatility clustering). The cloud compresses during liquidity squeezes and blasts open during genuine breakouts.
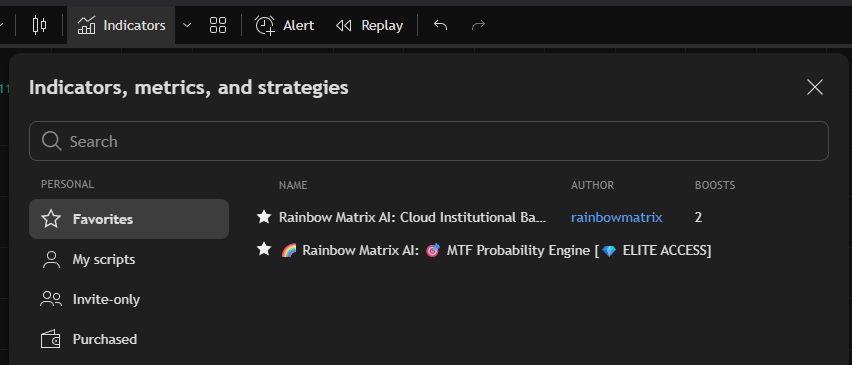
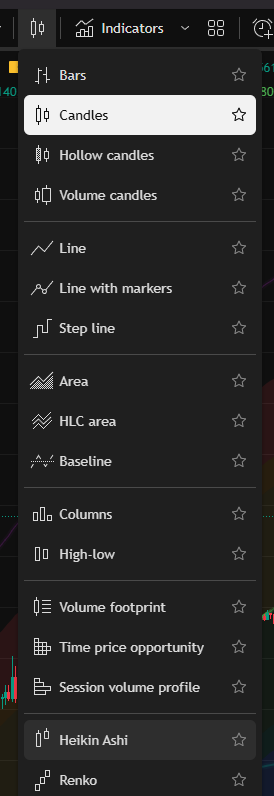
Implementation on TradingView
Step-by-step installation, workspace setup, the critical Heikin Ashi tactical protocol, and TradingView Free Plan compatibility configuration.
The indicator operates seamlessly across all TradingView tiers: FREE, Basic, Essential, Plus, and Premium. By consolidating all market intelligence into a single, high-density script, you eliminate the need for multiple simultaneous indicators.
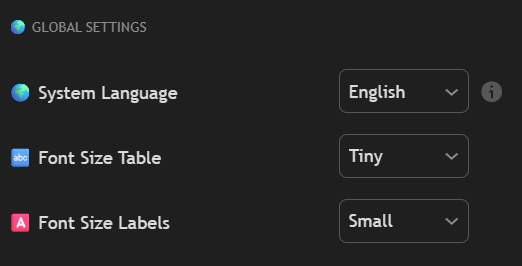
To hide cluttered input values: right-click chart → "Settings" → "Status line" tab → uncheck "Arguments". Your workspace remains clean, focused, and professional.
- Dark Theme: The indicator is specifically designed for Dark Mode, where glow effects and thermal zones stand out with maximum visual impact.
- Resolution: Minimum 1920×1080 for desktop trading to fully leverage all visual elements of the tactical HUD.
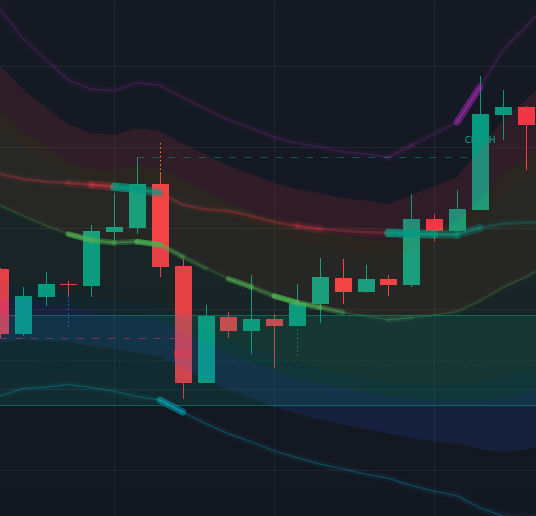
Traditional candlesticks show the raw reality of the market. Even in a clear uptrend, the alternating green and red candles generate a sense of permanent chaos for the novice trader — anxiety spikes, and emotional impulses hijack rational decision-making.
Heikin Ashi calculates an average of the current and previous candles, visually smoothing price action. The result: long streaks of the same color even in volatile markets — uptrends as continuous green blocks, downtrends as solid red blocks.
Heikin Ashi → Macro reading of trend and context.
Traditional Candlesticks → Precision entry and exit execution.
Rainbow Matrix AI → Real-time Probability Score.
Three complementary confirmations. One high-probability decision.
The Multi-Timeframe Probability Engine is fully compatible with TradingView's FREE plan. One small adjustment in the indicator settings unlocks 99% of the institutional intelligence without requiring any TradingView subscription upgrade.
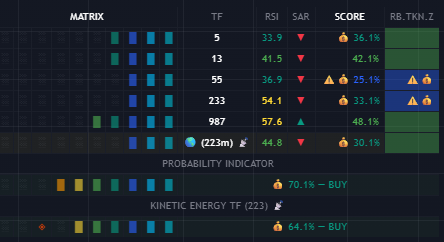
TradingView's free tier does not allow users to type custom timeframe values directly (e.g., 13m, 55m, 233m, 987m). Only built-in timeframes are selectable: 1m, 5m, 15m, 30m, 1h, 4h, 1D, 1W. Additionally, the live-data antenna icon only appears on these built-in timeframes — custom values run on stored historical data without real-time streaming for free accounts.
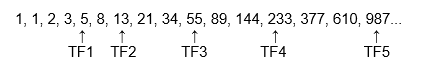
| Slot | Value | Role |
|---|---|---|
| TF1 | 5 min | Kinetic Trigger / Sniper |
| TF2 | 13 min | Intraday Filter |
| TF3 | 55 min | Macro Tier I |
| TF4 | 233 min | Macro Tier II — Fibonacci front-run |
| TF5 | 987 min | Base Anchor |
Mid-anchor: 223m Protocol — 10-minute asymmetric advantage against institutional 233m HFT cycles. Full strategic details in Chapter 04.
| Slot | Value | Built-in Equivalent |
|---|---|---|
| TF1 | 5 | 5 min ✅ |
| TF2 | 15 | 15 min ✅ |
| TF3 | 60 | 1 hour ✅ |
| TF4 | 240 | 4 hours ✅ |
| TF5 | 1440 | 1 Day ✅ |
Mid-anchor with this configuration: ~225m — functionally equivalent to the default 223m Protocol with only 1% deviation. The live-data antenna icon activates and full real-time signal generation is preserved.
- Full SNIPER / EXTREME / STRONG / PROBABLE signal hierarchy
- Complete MTF Probability Matrix HUD
- MGI Gravitational Physics (institutional walls)
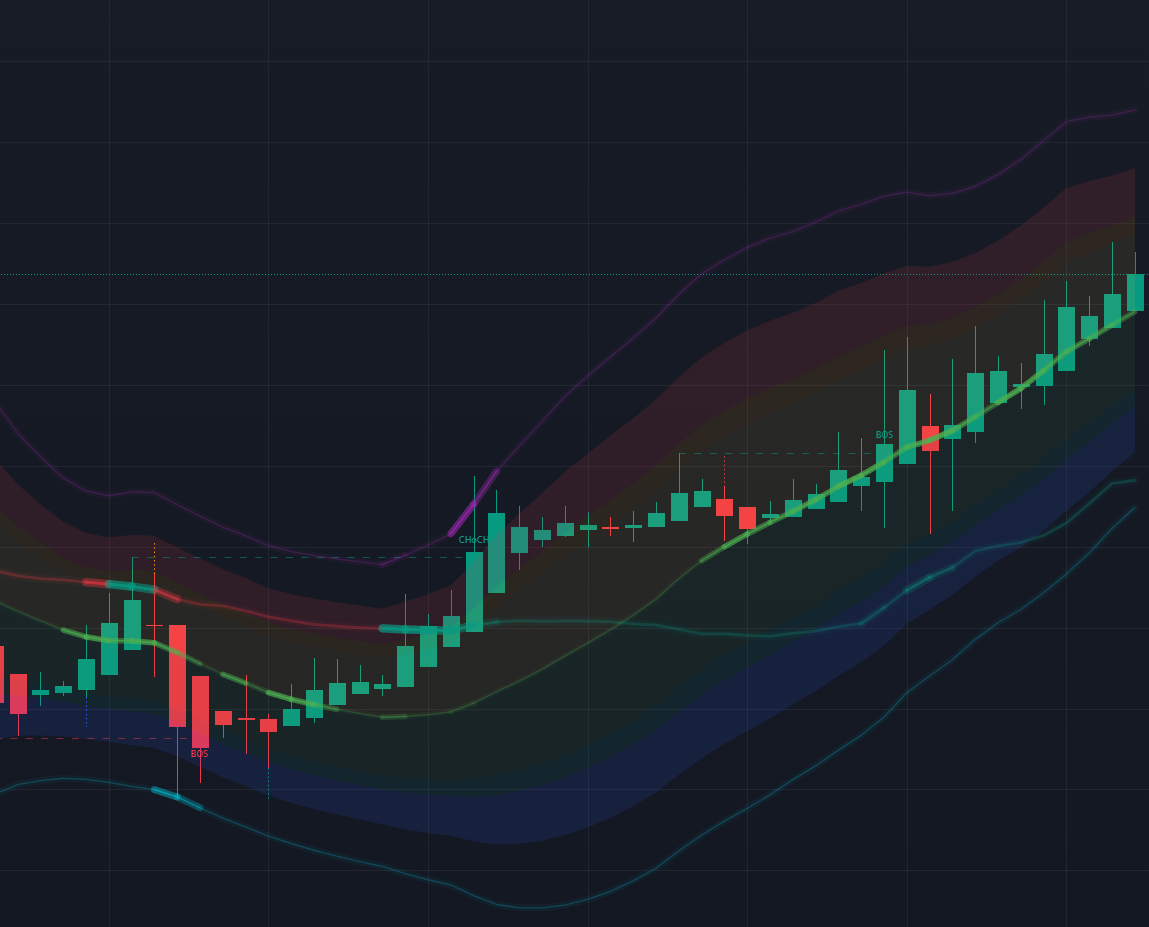
- Smart Money Concepts — Order Blocks, Fair Value Gaps, CHoCH, BOS
- AI Tactical Summary with Entry / SL / TP
- All 8 thermal Rainbow Cloud zones
- Real-time data streaming (live antenna icon active)
- Mobile push notifications
- All 5 native HUD languages
The exact 223m Protocol — front-running the institutional 233-minute Fibonacci HFT cycle by 10 minutes — requires TradingView Premium for the ability to input custom timeframe values directly. This is the only feature unlocked by upgrading TradingView (independent of the Rainbow Matrix subscription). For most operators, the Free-Compatible configuration delivers 99% of the institutional edge.
The Rainbow Cloud HUD is engineered exclusively for dark chart backgrounds. Light mode washes out thermal zones, signal glows, and color hierarchy — degrading signal readability by approximately 60%. Before reading any signal: TradingView top-right gear icon → Chart Settings → Appearance → Background → Dark.
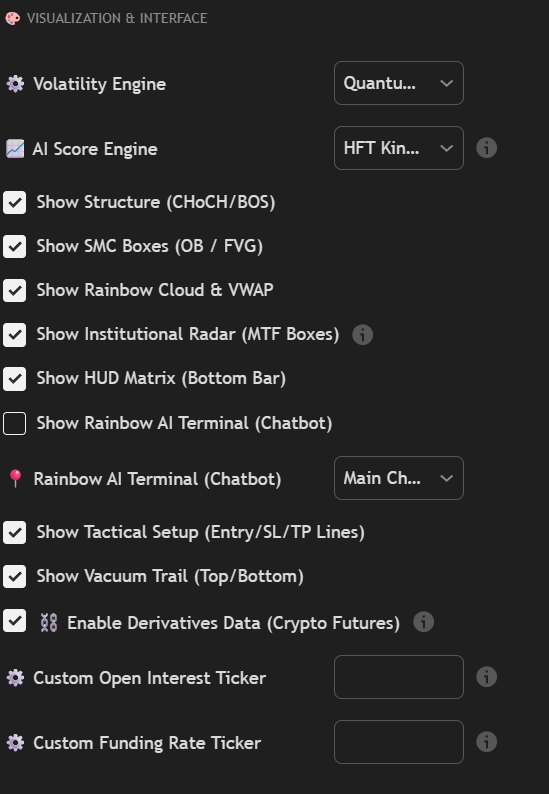
Configuration Menu
All 17 parameters of the Rainbow Matrix AI — from the Volatility Engine and dual AI Score brains to the Kinetic Regime Matrix, Divergence Engine, and MTF Synchronization.
| Mode | Description | Best For |
|---|---|---|
| Classic (StdDev) | Traditional academic Standard Deviation. Reliable and stable. | Macro, slow-moving markets |
| Quantum HFT (GK+EWMA) | Fuses Garman-Klass with RiskMetrics EWMA. Cloud breathes in real-time. | Crypto, Indices ⭐ Recommended |
The AI Score Engine is the core algorithm calculating the Global Probability Score — the precise metric between 0% and 100% that quantifies directional pressure across all 5 timeframes simultaneously.
The engine ships with two selectable brains. They read the same market through different lenses, and the operator chooses which drives the Score:
| Engine | Reads | Character |
|---|---|---|
| MGI Structural | Institutional volume walls and gravitational levels | Steadier. Anchored to where size actually sits. Fewer, higher-conviction shifts. |
| HFT Kinetic | Raw momentum and order-flow acceleration | Faster. Front-runs the move. Reacts before structure confirms. |
A [Dual] mode plots the secondary engine as a ghost line behind the primary, turning the two readings into a cross-validation tool: when MGI Structural and HFT Kinetic agree, conviction is highest; when they diverge, the market is in transition and the operator stands down until they re-align.
Treat agreement as confluence, not redundancy. The fast engine (HFT) tells you something is starting; the slow engine (MGI) tells you structure has confirmed it. The highest-probability entries live where the fast line has already moved and the structural line is catching up to meet it.
There is a kinetic phenomenon that dictates algorithmic market behavior with absolute structural consistency — a principle the retail masses have never been trained to audit. In physics, when a high-velocity mass rapidly displaces, the resulting vacuum creates a gravitational void that violently pulls the surrounding environment back to stabilize it. In algorithmic financial markets, the exact same principle applies to kinetic price action.
The Vacuum Trail renders this kinetic phenomenon entirely visible — a system of converging geometric vectors deployed directly on the oscillator console (not on the primary price chart). It engages the exact millisecond the Global Score breaches the upper or lower boundaries of the dynamic channel.
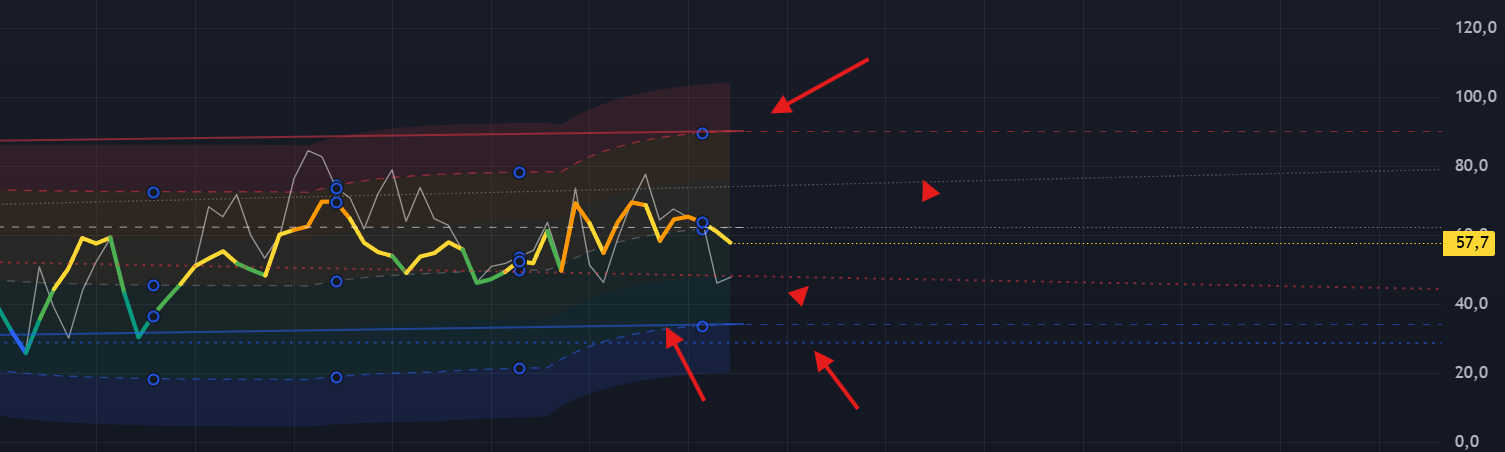
- Score severely above the channel: Buy-side flow is exhausted. Institutional Liquidity Void created above. Gravitational algorithmic force pulls the score back down. Red Trail maps the anticipated trajectory.
- Score severely below the channel: Sell-side flow is exhausted. Mathematical vacuum below kinetic price. Algorithmic mean reversion vector projected upward. Green Trail maps the anticipated trajectory.
- Centerline (Dashed White): Dynamic Channel Equilibrium Point. Primary take-profit target for the mean reversion sequence — the first coordinate of severe deceleration when the score snaps back from an extreme anomaly.
- Ghost Lines (Dotted, extending right): Historical Vacuum Trails projected horizontally as quantitative reference nodes — maps exact thresholds where the score suffered previous kinetic exhaustion.
It provides not just a directional bias, but the exact algorithmic target coordinate for the reversion. The retail trader sees the score is extreme and blindly counter-trades. The Elite operator sees the precise mean-reversion trajectory and the high-probability deceleration zone.
Beyond raw score telemetry, the Rainbow Matrix AI's Tactical Setup architecture compresses three lethal sub-engines into a single execution layer: the Asymmetrical R:R Filter, JSON Webhook Automation, and the Kinetic Direction Change coordinate marker.
This is one of the most lethal and sophisticated engines within the Tactical Setup architecture — entirely invisible to anyone merely looking at lines on a chart. Before rendering the final execution coordinates, the system automatically calculates the structural R:R ratio of the setup and mathematically audits it against the operator's minimum threshold.
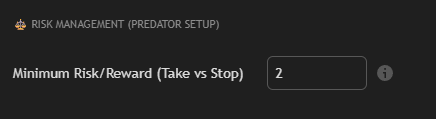
- Default Minimum R:R Threshold = 2.0: For every 1 unit of kinetic risk, the target must mathematically extract a minimum of 2 reward units.
- Structural R:R < 2.0 (Barrier Too Close): Engine algorithmically bypasses the shallow barrier. Computes Take Profit = Entry + (Risk × Min R:R Threshold). Projects extraction to the mathematically compensatory level.
- Structural R:R ≥ 2.0: Engine respects the natural institutional barrier — high-probability mean reversion target preserved.
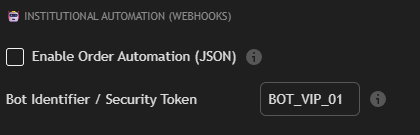
For quantitative operators deploying automated execution bots, the Tactical Setup engine integrates via dynamic JSON Webhooks. When armed in the configuration panel — 🤖 INSTITUTIONAL AUTOMATION → Enable Order Automation (JSON) — the exact millisecond an Apex Strike Protocol is mathematically validated, the engine transmits a payload containing the absolute execution coordinates:
Flags the exact coordinate where kinetic dominance structurally shifts from Buyers to Sellers (or vice versa). This is not a momentum signal — it is the mathematical inversion of the dominant kinetic vector at the resolution of the active fractal.
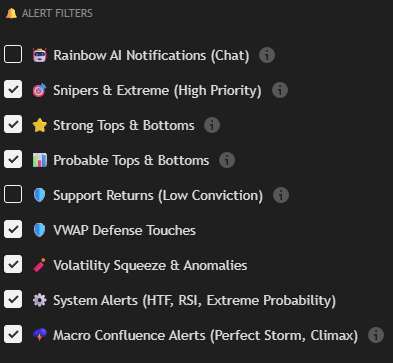
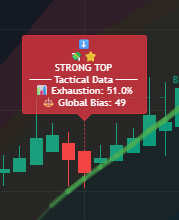
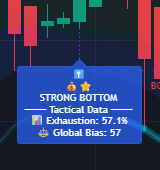
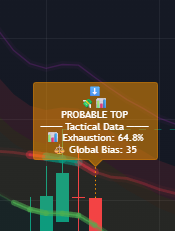
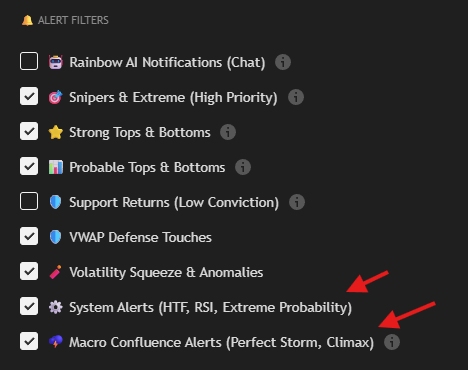
The Signal Hierarchy — from maximum lethality to minor contextual alerts:
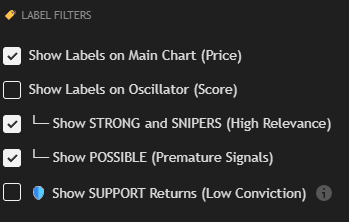
- Chart Labels: ✅ ON
- Oscillator Labels: ❌ OFF
- Strong/Snipers: ✅ ON
- Probable: ✅ (With Caution)
- Support: ❌ OFF
- Chart Labels: ✅ ON
- Oscillator Labels: ✅ ON
- Strong/Snipers: ✅ ON
- Probable: ✅ ON
- Support: ❌ OFF
- Chart Labels: ✅ ON
- Oscillator Labels: ✅ ON
- Strong/Snipers: ✅ ON
- Probable: ✅ ON
- Support: ✅ ON
Click the Alert 🔔 icon → "Create Alert" → Condition: Any alert() function call (CRITICAL — do NOT select specific price conditions) → Trigger: Once Per Bar Close → Arm notifications (App + Email + Webhook) → Click "Create".
| Alert | Default | Directive |
|---|---|---|
| 🎯 Snipers & Extreme | ✅ ON | NEVER DISABLE. Rarest, most asymmetrical execution windows. |
| ⭐ Strong Structural Reversals | ✅ ON | Keep Armed. Foundational trigger for high-probability setups. |
| 📊 Probable Reversals | ✅ ON | Arm with calibrated expectations. Pre-warning radar. |
| 🛡️ Support Mitigations | ❌ OFF | Keep Disabled. High noise, negligible reliability. |
| ⚓ Macro VWAP Collisions | ✅ ON | Keep Armed. Massive institutional liquidity events. |
| 🧨 Kinetic Squeeze Anomalies | ✅ ON | NEVER DISABLE. Most urgent systemic alerts. |
| ⚙️ Macro Systemic Alerts | ✅ ON | Keep Armed. Statistical extremes across all fractals. |
| 🌩️ Absolute Macro Confluence | ✅ ON | NEVER DISABLE. Rarest, trend-defining events. |
| Parameter | Default | Range | Effect |
|---|---|---|---|
| Magnetic Radius (%) | 0.25% | 0.15% – 0.50% | Distance from wall where MGI activates. Wider = more anticipation. |
| Gravitational Force | 6 | 3 – 10 | Points injected into Score per wall. Max cap: ±30 points total. |
| MGI Polarity | Magnetic 🧲 | Magnetic / Friction | Magnetic = stop-hunt protocol (Crypto). Friction = absorption (Forex/Equities). |
| Smart Wall | On | On / Off | Wall force adapts to approach speed. Fast approach hardens the wall (rejection-friendly); slow drift softens it (break-friendly). |
The Smart Wall upgrade makes each institutional level dynamic rather than static. A wall is not a fixed line — its strength scales with how violently price approaches it. A rapid, high-velocity approach is read as an exhaustion spike and the wall is reinforced, favouring rejection; a slow, grinding approach softens the wall, favouring a clean break. Polarity sets the bias of the whole field: Magnetic (attract — levels pull price in for the stop-hunt, ideal on Crypto) or Friction (dampen — levels absorb and stall momentum, ideal on Forex and equities).
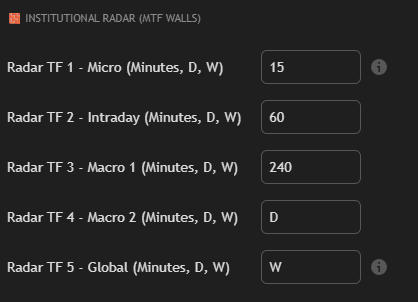
| Fractal | Default | Weight | Role |
|---|---|---|---|
| TF1 — Kinetic Trigger | 5 minutes | 15% | The Sniper. Detects exact millisecond for capital deployment. |
| TF2 — Intraday Filter | 13 minutes | 20% | The Squad Leader. Algorithmically purges false TF1 signals. |
| TF3 — Macro Tier I | 55 minutes | 25% | The Field Commander. Defines the dominant intraday structural trend. |
| TF4 — Macro Tier II | 233 minutes | 25% | The Theater Commander. Medium-term institutional positioning. |
| TF5 — Base Anchor | 987 minutes | 15% | The Satellite. Long-term macro context. Weeks-defining anchor. |
TF1 < TF2 < TF3 < TF4 < TF5 — Ascending chronological hierarchy is mathematically mandatory. Injecting timeframes out of order will structurally break the synchronization engine and generate critically corrupted telemetry.
The HUD splits the energy of price into two distinct readings, then classifies the market into one of four regimes. This separation is the difference between knowing price is moving and knowing price is loaded — two things that are often confused and almost never the same.
| Bar | Measures | Built From |
|---|---|---|
| Kinetic Force | Motion — how fast price is moving right now | Candle range / ATR (P3) + Heikin Ashi body intensity (P4), weighted 50/50 |
| Potential | Position — how stretched and loaded price is | Global Score stretch (P1) + price stretch within the rainbow (P2), weighted 50/50 |
A ◈ high-water mark inside the Kinetic Force bar remembers the peak force of the current directional leg — when force fades but the ◈ stays high, momentum is bleeding out of the move.
The two bars feed a 2×2 Regime Matrix. Each bar is read as high or low against a threshold of 50, producing four states:
| Regime | Force | Potential | What It Means |
|---|---|---|---|
| 🧊 COILED | < 50 | < 50 | Both low. Pre-breakout compression or chop. The market is resting — do not force a trade. |
| 🚀 EARLY MOVE | ≥ 50 | < 50 | Motion building, price not yet stretched. Often the cleanest part of a fresh move — the entry window. |
| ⏳ EXHAUSTION | < 50 | ≥ 50 | Price is stretched and loaded but momentum is fading. Stalling — tighten stops, watch for reversal. |
| 💥 CLIMAX | ≥ 50 | ≥ 50 | Both maxed. A powerful move is in progress — but this is also where blow-off tops and capitulation bottoms form. |
The regime is a context filter, not a signal by itself. The lethal combinations: enter on EARLY MOVE in the direction of force; take profit or stand aside on EXHAUSTION; and treat CLIMAX paired with a bearish divergence (see 3.17) as a high-probability reversal warning — maximum energy meeting a momentum split is how tops and bottoms are built.
The Divergence Engine compares pivots of the Global Score against pivots of price to detect the four classical divergence types. It is visual-only — it never alters the Score — and it is pivot-confirmed, meaning it waits for a pivot to fully form before drawing. It does not repaint.
| Type | Price | Score | Reading | Default |
|---|---|---|---|---|
| Regular Bullish | Lower Low | Higher Low | Reversal up — seller exhaustion (solid line) | On |
| Regular Bearish | Higher High | Lower High | Reversal down — buyer exhaustion (solid line) | On |
| Hidden Bullish | Higher Low | Lower Low | Continuation up, in an uptrend (dashed line) | Off |
| Hidden Bearish | Lower High | Higher High | Continuation down, in a downtrend (dashed line) | Off |
| Parameter | Default | Range | Effect |
|---|---|---|---|
| Pivot Lookback | 5 | 2 – 20 | Bars on each side required to confirm a pivot. Use 3 for 1m–5m, 5 for 15m–1h, 10+ for 4h–daily. |
| Divergence Alerts | Off | On / Off | Fires one Bullish and one Bearish alert when a divergence confirms. |
Because a divergence confirms lookback bars after the second pivot forms, the signal is reliable but lagging by design. Higher lookback means more reliable pivots and more lag. Hidden divergences are Off by default — enable them only in clearly trending markets, where continuation setups are valid.
Quantitative Asymmetry: The 223-Minute Front-Running Protocol
How to mathematically front-run the institutional HFT clock by exactly 10 minutes.
The retail herd universally executes on a highly predictable temporal grid: 5m, 15m, 1H, 4H. Because these coordinates are standard and globally popular, they are the exact zones mathematically targeted by institutional liquidity engines to engineer stop-hunts and traps.
Tier-1 institutional capital operates explicitly on the 233-minute temporal fractal — a pure Fibonacci coordinate. This is where colossal liquidity orders are deployed.
| Standard Retail | HFT Institutional | Rainbow Matrix Elite |
|---|---|---|
| 4H (240 min) Sees the past |
233 min (Fibonacci) Runs in bulk |
223 min (Front-Running) 10 min advance |
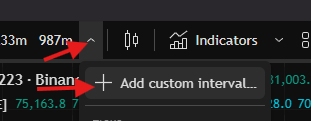
Target the active temporal resolution menu (e.g., "1H") on the primary TradingView toolbar → Directly type 223 into the numerical input field → Select Minutes from the dropdown → Press Enter.
Result: Your terminal is now algorithmically synchronized to front-run the institutional clock.
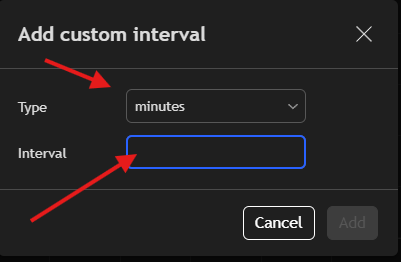
By anchoring your terminal to the 223-minute resolution, your kinetic candle closes exactly 10 minutes before the massive Fibonacci block of HFT algorithms executes on the 233-minute threshold. You cease reacting to Smart Money — you anticipate them.
Multi-Fractal Architecture: The Quantitative Asymmetry
The 5-dimensional temporal matrix and the Synthetic Master Fractal — the Global Score.
Auditing an isolated temporal fractal is the tactical equivalent of navigating a battlespace while staring exclusively through a micro sniper scope. Retail operators trapped in the 5-minute chart are systematically liquidated on a daily basis by the dominant macro vector of Higher Timeframe algorithms.
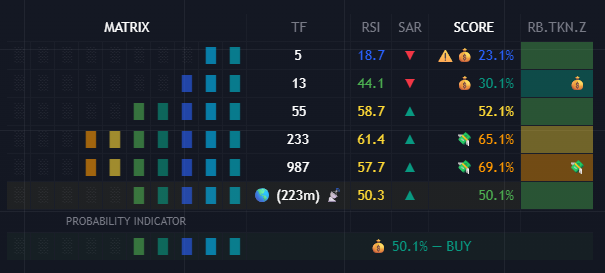
Within every millisecond, across each of the 5 temporal dimensions, the system processes a heavy quantitative data matrix:
- Log-Normal Z-Score: Exact kinetic deviation of price relative to algorithmic equilibrium, in terminal standard deviations.
- Institutional VWAP & Volume Profile (POC/VAH/VAL): Precise structural nodes where massive institutional liquidity was absorbed or deployed.
- Kinetic RSI: Algorithmic momentum calibrated to each specific time horizon.
- Adaptive SAR: Absolute structural directional vector.
- Fractal Score: Mathematical synthesis of all localized quantitative data within that tier.
To physically replicate this level of telemetry, an operator would require a 5-monitor array, running 10 distinct indicators per screen, attempting to manually compute 50 independent variables per millisecond. Rainbow Matrix AI compresses all of this into one absolute mathematical probability metric.
| 🇺🇸 English | 🇧🇷 Portuguese | 🇪🇸 Español | 🇷🇺 Русский | 🇨🇳 中文 |
|---|---|---|---|---|
| Native | Native | Native | Native | Native |
Linguistic calibration executes at absolute zero-latency, requiring no terminal reboot or data-feed refresh.
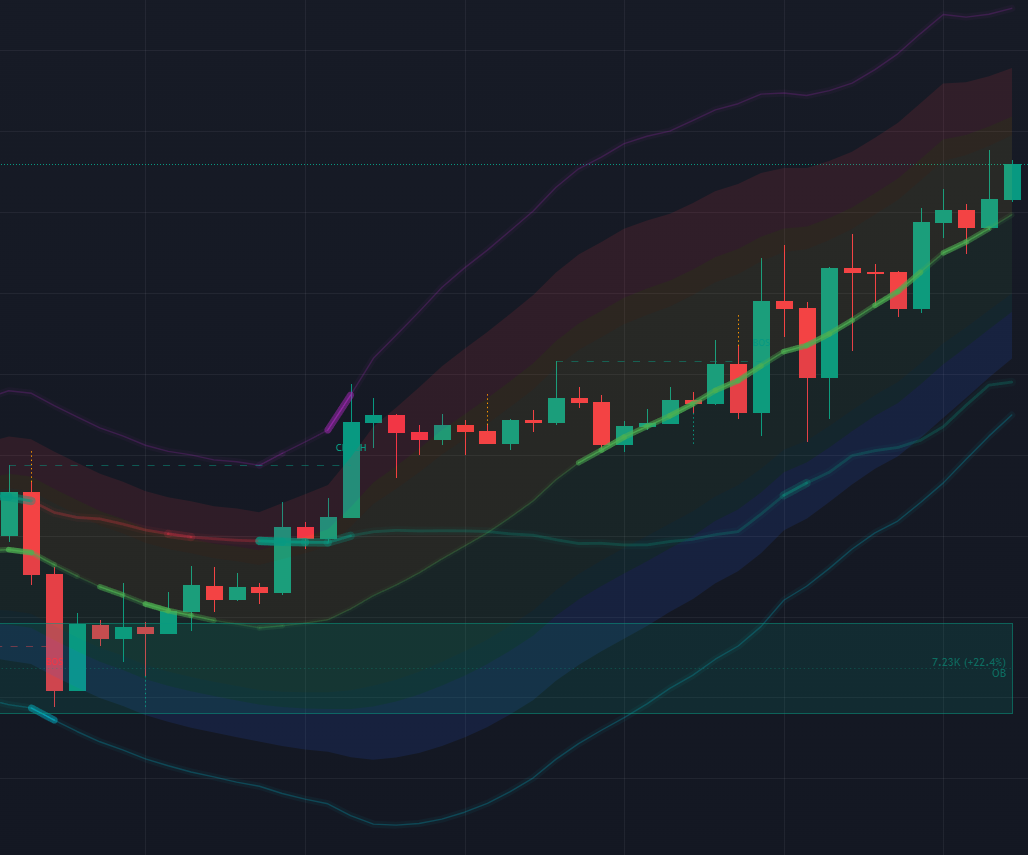
The Gravitational Ecosystem: Rainbow Cloud & Institutional VWAPs
High-Fidelity Optical Telemetry — thermal zones, log-normal deviation, and Black Swan phosphorescence.
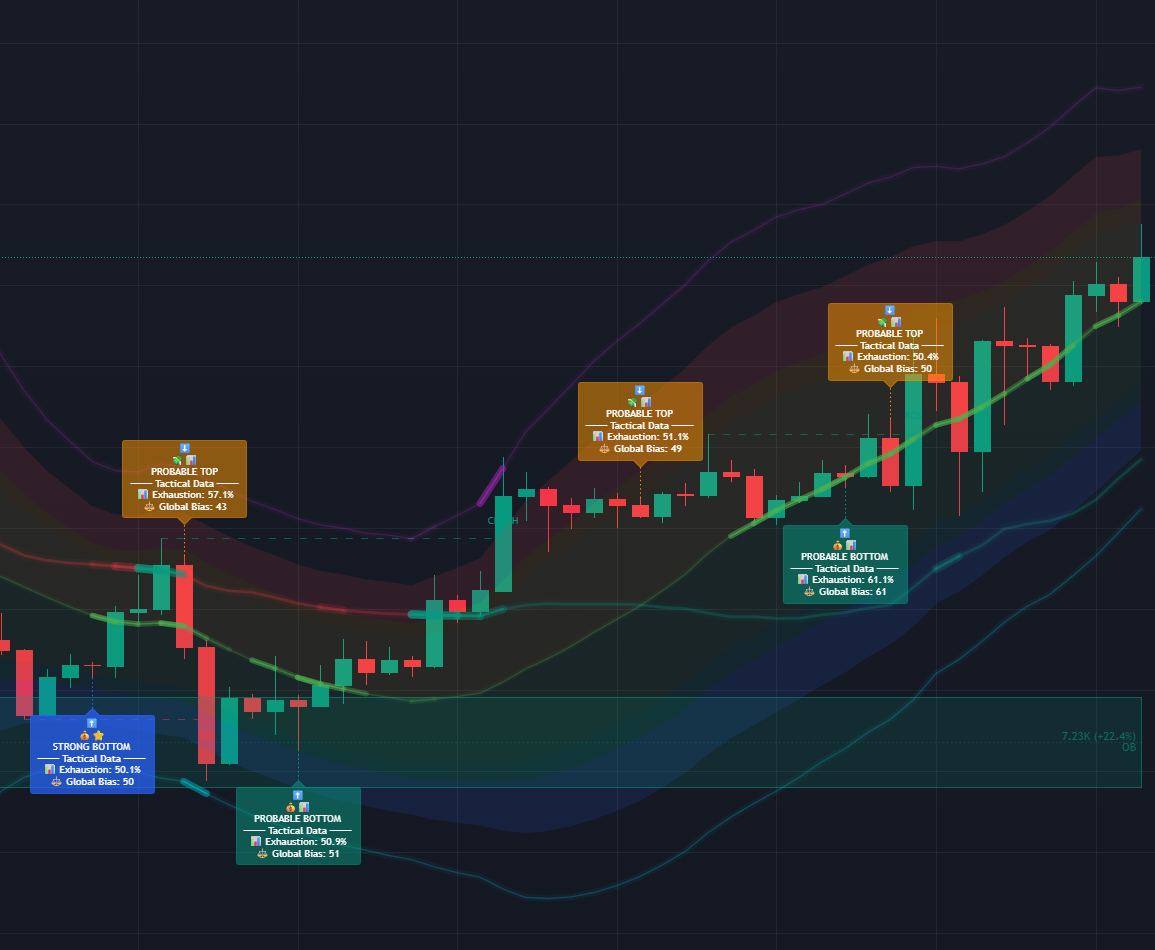
This is categorically not a primitive retail Bollinger Band. It is a highly advanced Log-Normal Standard Deviation matrix generating algorithmic thermal thresholds that map the exact mathematical probability of a structural reversal with surgical statistical fidelity.
When kinetic price breaches the 4th logarithmic standard deviation (less than 1% of the time), two hyper-violent outcomes are possible:
1. Explosive Mean-Reversion (Primary Probability): Tier-1 capital weaponizes the panic, engineering aggressive counter-vector accumulation. The snapback is instantaneous, asymmetrical, and highly violent.
2. Cascading Liquidation Event: Price temporarily defies gravity — a margin-call cascade systematically destroying premature counter-trend operators before the inevitable reversion.
⚠️ Absolute Directive: Never blindly fade the kinetic vector at this threshold without absolute mathematical authorization from the Synthetic Global Score.
- Dynamic Macro VWAP: Visually intensifies and "heats up" as kinetic price approaches. Spatial proximity exponentially magnifies the optical flare.
- Daily VWAP (D): Reset at the exact initiation of the 24H session. Primary magnet for intraday algorithmic sweeps.
- Weekly VWAP (W): Absolute center of gravity for Tier-1 capital. A definitive breach mathematically dictates a severe macro regime shift.
- Monthly VWAP (M): The apex institutional anchor. A crossover confirms a massive, multi-fractal trend inversion is actively underway.
The Institutional Radar: MGI and Algorithmic Liquidity Walls
Volume Profile walls, gravitational physics of Smart Money, Order Blocks, and Fair Value Gaps.
| Level | Description | Behavior |
|---|---|---|
| POC — Point of Control | Highest volume density coordinate. Absolute algorithmic center of gravity. | Price exhibits severe tendency to revert to POC after extreme deviations. |
| VAH — Value Area High | Upper boundary of 70% accepted institutional volume. | Thin liquidity vacuums above VAH — frequent violent algorithmic rejection. |
| VAL — Value Area Low | Lower boundary of the 70% Value Area. | Price is systematically rejected and forced back inside the accepted volume matrix. |
| Historical VWAP D/W/M | Long-term volume-weighted anchorages. | Gravitational density strictly proportional to temporal length (Monthly > Weekly > Daily). |
Wall acts as an absorption barrier. MGI decelerates the AI Score as price approaches — accurately anticipating momentum will be absorbed and repelled.
📌 Forex · Equities · Indices
Wall acts as a black hole. MGI aggressively accelerates the probability vector into the extreme — anticipating Tier-1 engines will violently pull price through to purge retail stops.
📌 Crypto Derivatives · BTC · Altcoins ⭐
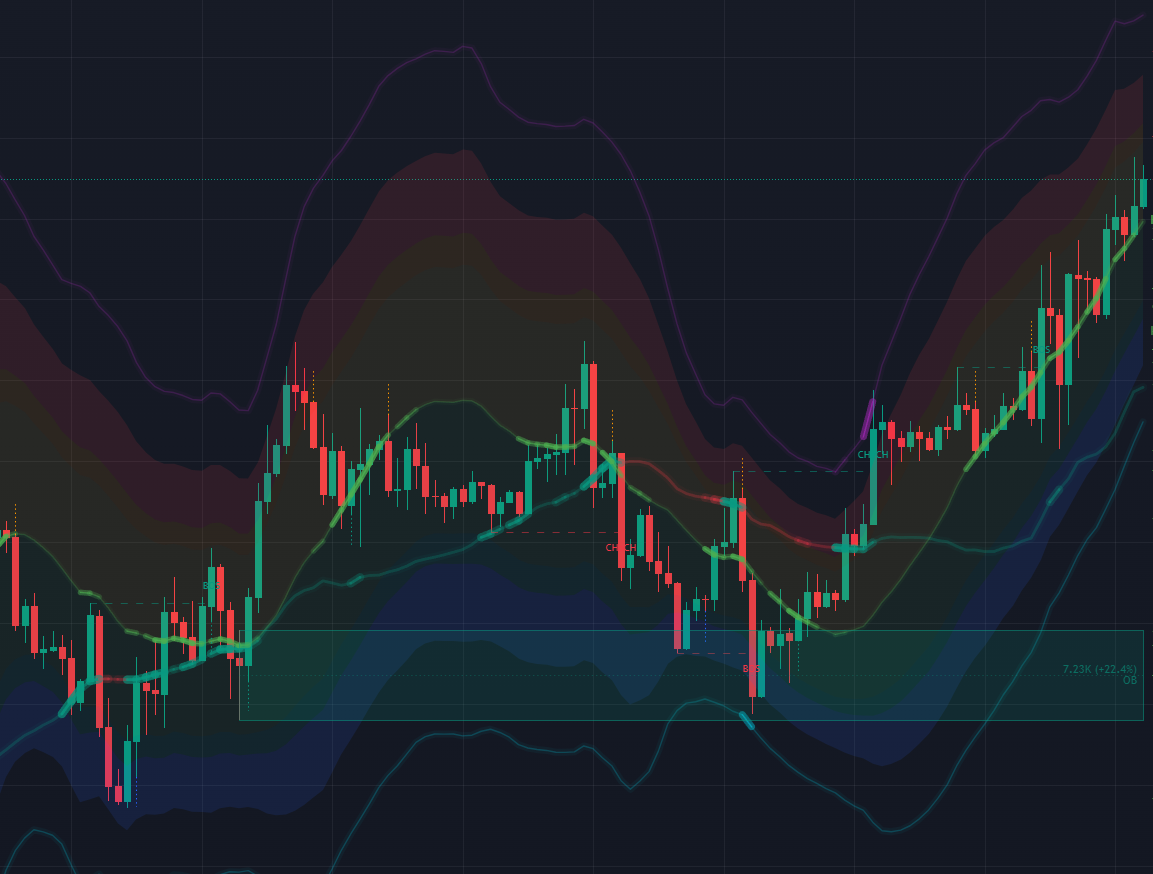
- Order Blocks (OB): Strictly validated by abnormal kinetic volume injection. Localized coordinates where Tier-1 algorithms have stacked massive limit orders. High probability of price reverting to these zones.
- Fair Value Gaps (FVG): Translucent structural voids mapping severe price inefficiencies engineered by aggressive institutional market orders. The algorithm anticipates price will eventually return to mitigate these inefficiencies.
When the Synthetic Global Score breaches an absolute extreme (>90% systemic exhaustion) at the exact millisecond kinetic price physically mitigates a validated Order Block, the engine dynamically fuses these two data streams and deploys a SNIPER telemetry alert — representing the absolute maximum quantitative convergence achievable within the system.
There is a hidden dimension to the cryptocurrency algorithmic battlespace that the vast majority of retail operators completely ignore — and that institutional whales obsessively monitor. It is the derivatives telemetry layer: Perpetual Futures Contracts, Open Interest (OI), and the Funding Rate (FR). This quantitative data reveals not just where kinetic price is currently located, but exactly where massive capital is heavily leveraged, and how statistically vulnerable that capital is to algorithmic liquidity sweeps.
Open Interest measures the total volume of active, unsettled derivative contracts natively open in the market. It is the absolute mathematical footprint of leveraged capital.
- OI Rising + Price Rising: Aggressive capital entering Long positions. Bullish momentum backed by genuine kinetic volume. Structurally healthy uptrend.
- OI Falling + Price Rising: Short positions being forcibly closed (short squeeze). The move lacks fresh capital — high probability of imminent exhaustion.
- OI Rising + Price Falling: Aggressive capital entering Short positions. Bearish momentum confirmed.
- OI Falling + Price Falling: Long positions being liquidated. Move lacks fresh sellers — bearish momentum questionable.
The Funding Rate is the periodic payment exchanged between Long and Short perpetual positions to keep the contract price anchored to the spot index. It is the asymmetrical cost of holding leverage — and reveals the dominant directional bias of leveraged capital.
- FR Extremely Positive: Longs are paying Shorts heavily. Excessive long bias — leveraged retail trapped on the wrong side. High probability of cascade liquidation downward.
- FR Extremely Negative: Shorts are paying Longs heavily. Excessive short bias — perfect ignition for a short-squeeze rally.
✅ ENGAGE when: executing Cryptocurrency Perpetual Futures on Tier-1 exchanges (Binance, Bybit, OKX). Active chart ticker must be a perpetual contract (e.g., BTCUSDT.P, ETHUSDT.P).
❌ DO NOT ENGAGE when: operating Spot Markets, Forex, Traditional Equities, Indices, or Commodities. The active ticker must possess native Open Interest telemetry.
If mistakenly enabled on an unsupported asset, the ignore_invalid_symbol=true engine protocol automatically suppresses the error, allowing the core indicator to function uninterrupted.
OI and FR are risk-exposure multipliers — they are not isolated buy/sell triggers. Always confirm directional bias via the Synthetic Global Score and Tactical Setup architecture first. Derivatives telemetry amplifies confluence; it does not replace it.
Tactical Engagements & Frequently Asked Questions
Direct answers to the most critical operational questions from verified Elite operators.
✅ Affirmative. The master architecture compresses its entire quantitative array into a single execution script. You exclusively require a basic, free account and active Elite authorization.
✅ Negative. The Matrix is an advanced Tactical Telemetry & Decision-Support Architecture. You, the tactical operator, retain absolute executive authority over capital deployment.
✅ Negative. The physics of algorithmic order flow and log-normal variance are mathematically universal. The engine calibrates to Crypto, FX, Equities, Indices, and Commodities.
✅ Negative. Absolute Zero-Repaint Protocol. A trigger is permanently rendered strictly upon candle close. What you audit in historical backtesting is the exact, immutable mathematical reality that was broadcast during live execution.
✅ The 223-Minute Fractal (Refer to Chapter 4). However, the engine functions with maximum fidelity across any temporal resolution.
✅ Await the strict confirmation of a Structural Reversal Trigger (Sniper / Strong label). Execute immediately, anchoring your Stop-Loss behind the coordinates provided by the Tactical Setup. Never blindly fade without structural telemetry confirmation.
✅ Affirmative. Elite clearance grants unhindered, simultaneous access across all assets and temporal fractals.
✅ contact@rainbowmatrix.ai — strictly reserved for verified Elite operators.
Capital Preservation Architecture: The Absolute Rule of Survival
The mathematics of survival. The 1–2% Terminal Directive that separates operators from gamblers.
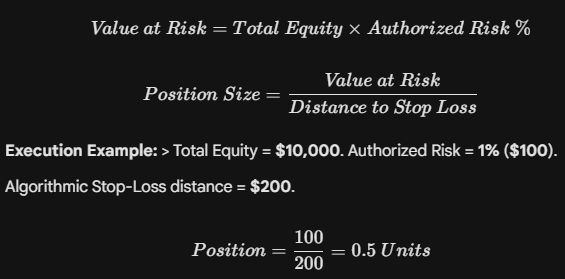
An operator who risks 10% of total equity per execution and encounters standard statistical variance (5 consecutive drawdowns — a mathematical certainty even with apex telemetry) instantly loses 41% of their entire terminal. Conversely, an operator who rigidly caps risk at 1% per execution across the identical 5-drawdown sequence suffers a negligible 5% equity hit.
Strictly cap exposure at maximum 1% of total equity per execution. No exceptions.
Authorized up to 2% equity exposure, strictly confined to confirmed STRONG or SNIPER apex triggers.
Never exceed 2% equity risk on a single execution vector, regardless of structural conviction or confluence.
Relentless consistency in capital preservation is the absolute dividing line between Tier-1 operators who extract liquidity and retail operators who serve as it.
System Diagnostics & Tactical Troubleshooting
Resolve the most frequent systemic anomalies without requiring engineering support escalation.
- Audit Expiration: Verify the telemetry hook has not expired. Tier-0 profiles impose a strict 30-day expiration.
- Audit Condition: Ensure trigger condition is strictly anchored to Any alert() function call.
- Audit Mobile: iOS/Android Settings → Notifications → TradingView → ensure push telemetry is authorized.
- System Reset: Delete the corrupted alert hook entirely and re-initialize following the Chapter 3 protocol.
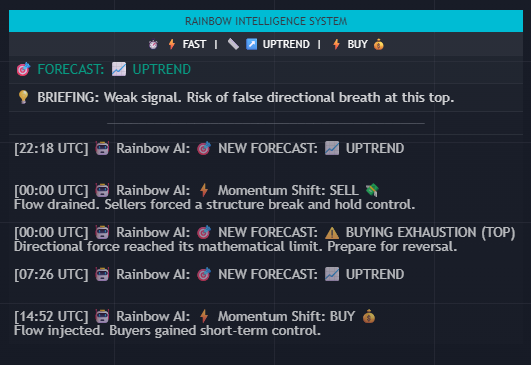
- Parameter Audit: Verify Show Rainbow AI Terminal directive is actively checked in settings.
- Positioning Audit: Verify terminal anchor point is correctly assigned to Main Chart or Oscillator Pane.
- Z-Index Conflict: Alter the Terminal's anchored corner to a clean sector of the screen.
- Browser: Deploy updated Chromium-based architecture (Chrome, Brave, Edge). Firefox is not optimized for heavy PineScript rendering.
- Resource: Temporarily disable Show Institutional Radar and Show SMC Boxes — the heaviest graphical processors.
- Data: Right-click chart → Chart Settings → Data → restrict amount of historical bars rendered.
- The Tactical Setup mandates 4 simultaneous mathematical conditions. Most frequent restriction: Global Score was below 70% at signal time — intentional suppression of low-probability layout.
- A Volatility Squeeze may be active. Engine refuses to render tactical lines inside compressed liquidity zones.
- Confirm that Show Tactical Setup is actively authorized in indicator settings.
- Verify active subscription status directly at rainbowmatrix.ai.
- Ensure your precise TradingView ID is correctly logged in the portal. Access tokens are bound to TradingView Usernames, not email addresses.
- Transmit your exact TradingView username and error logs to contact@rainbowmatrix.ai for manual engineering override.
Systemic Risk Disclosures & Absolute Legal Directives
Mandatory statistical risk directive and proprietary architecture intellectual property restrictions.
The Rainbow Matrix AI is a highly advanced quantitative telemetry and log-normal anomaly detection architecture. Any "Historical Accuracy" metrics rendered within the Master HUD mathematically audit past kinetic variance via ATR amplitude routing. This quantitative data strictly DOES NOT constitute financial advice, investment recommendations, or any mathematical guarantee of future kinetic outcomes.
The algorithmic battlespace is hyper-lethal and carries severe, ever-present risks of total capital liquidation. Tactical execution is the absolute and sole responsibility of the operator.
The physical deployment of the algorithmic Stop-Loss coordinates calculated by the Matrix's Tactical Setup is a rigid, non-negotiable architectural requirement. Disregarding these mathematical invalidation levels violates the core quantitative philosophy of the engine, instantly downgrading your operation from Tier-1 tactical execution to primitive retail gambling.
This tactical manual and its underlying mathematical frameworks are heavily classified for the exclusive deployment of verified Rainbow Matrix AI Elite operators. All proprietary architecture, quantitative methodologies, and structural intelligence contained herein are strictly protected by international intellectual property law. Unauthorized replication, reverse-engineering, or unauthorized external distribution is strictly prohibited and will result in immediate algorithmic lockout and active legal engagement.
🌐 rainbowmatrix.ai · ✉️ contact@rainbowmatrix.ai
© Rainbow Matrix AI · All rights reserved · Confidential Document for Elite Members