Four independent instruments.
Each one solves a distinct piece of the institutional puzzle — volatility envelopes, liquidity walls, order-flow probability, and trend clarity. Run them alone or stack them together.
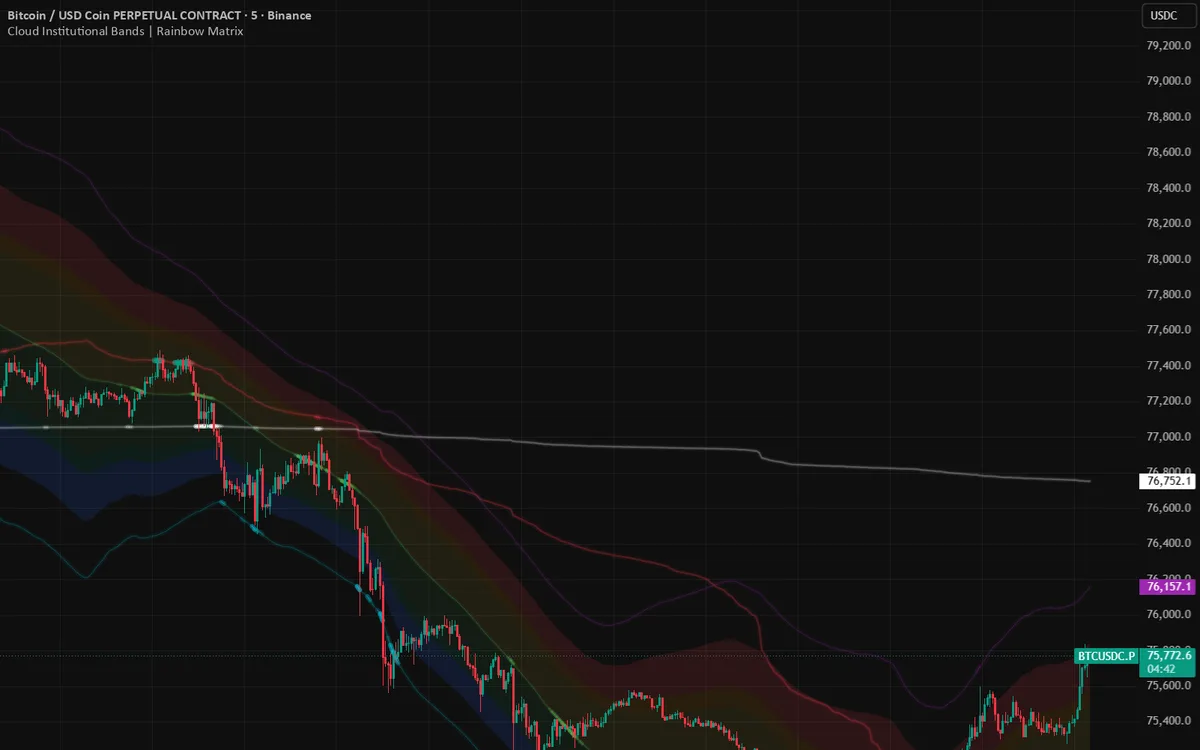
🌈 Cloud Institutional Bands
Log-Normal regression VWAP bands that map institutional accumulation and exhaustion zones — statistically corrected for the asymmetric distribution of price.
- ✓ 8 thermal deviation zones (4 above / 4 below base)
- ✓ Fibonacci sigma multipliers (1.50/1.85/2.75/3.85)
- ✓ Dynamic VWAP with proximity glow
- ✓ Black Swan zone alerts + Zone Info HUD
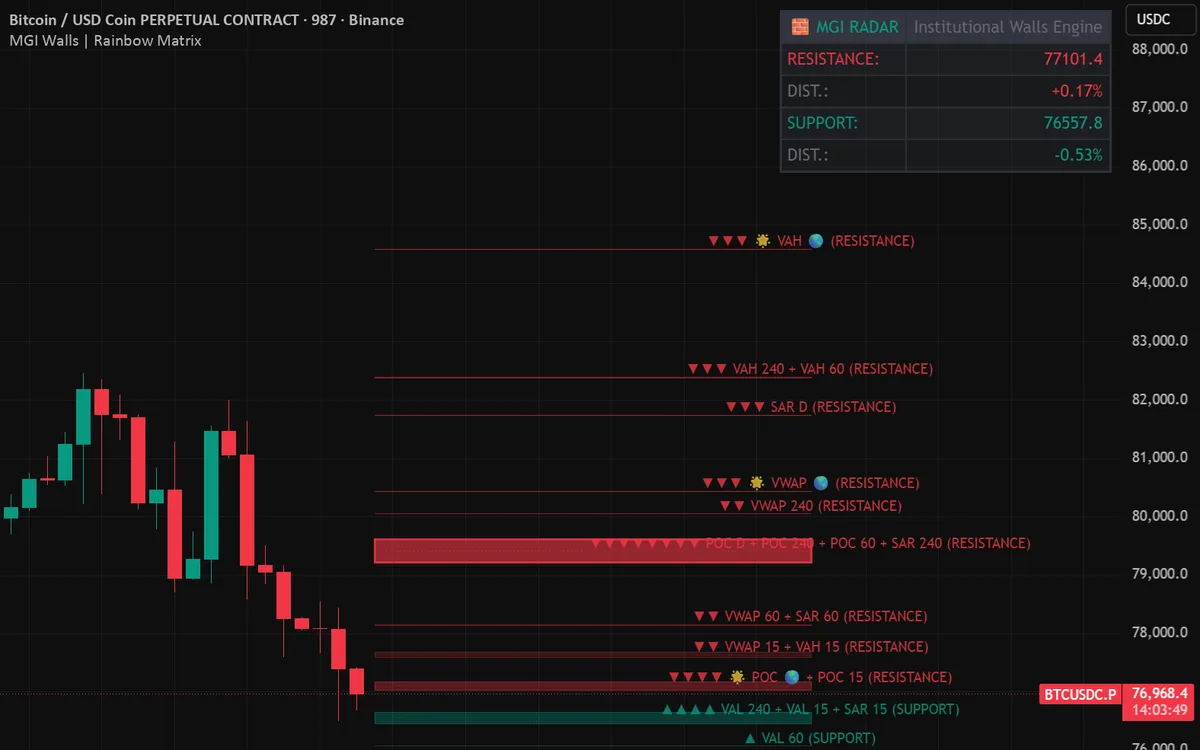
🧱 MGI Walls — Liquidity Radar
Multi-timeframe institutional liquidity radar. Extracts Volume Profile, Anchored VWAPs and SAR levels from 5 macro horizons and fuses overlapping zones into intensified walls.
- ✓ MTF Volume Profile (POC / VAH / VAL)
- ✓ Anchored VWAPs (Daily / Weekly / Monthly)
- ✓ Wall Fusion Engine with polarity coloring
- ✓ Nearest Wall HUD + collision alerts
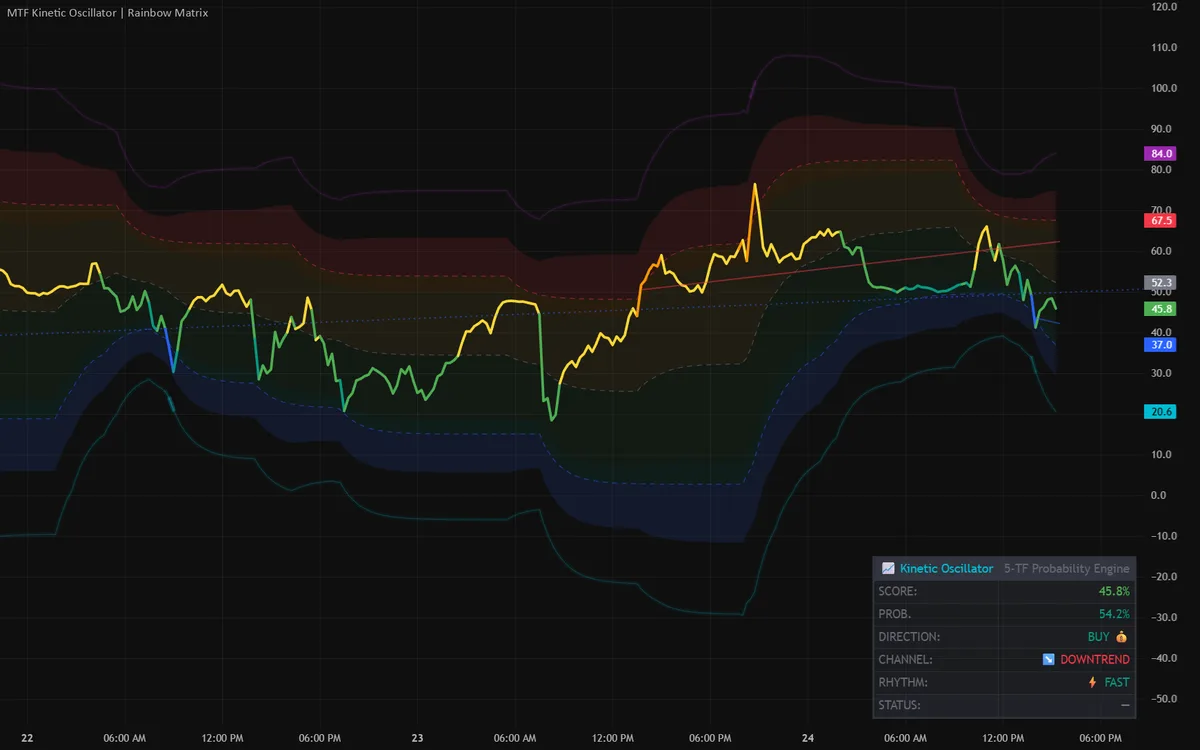
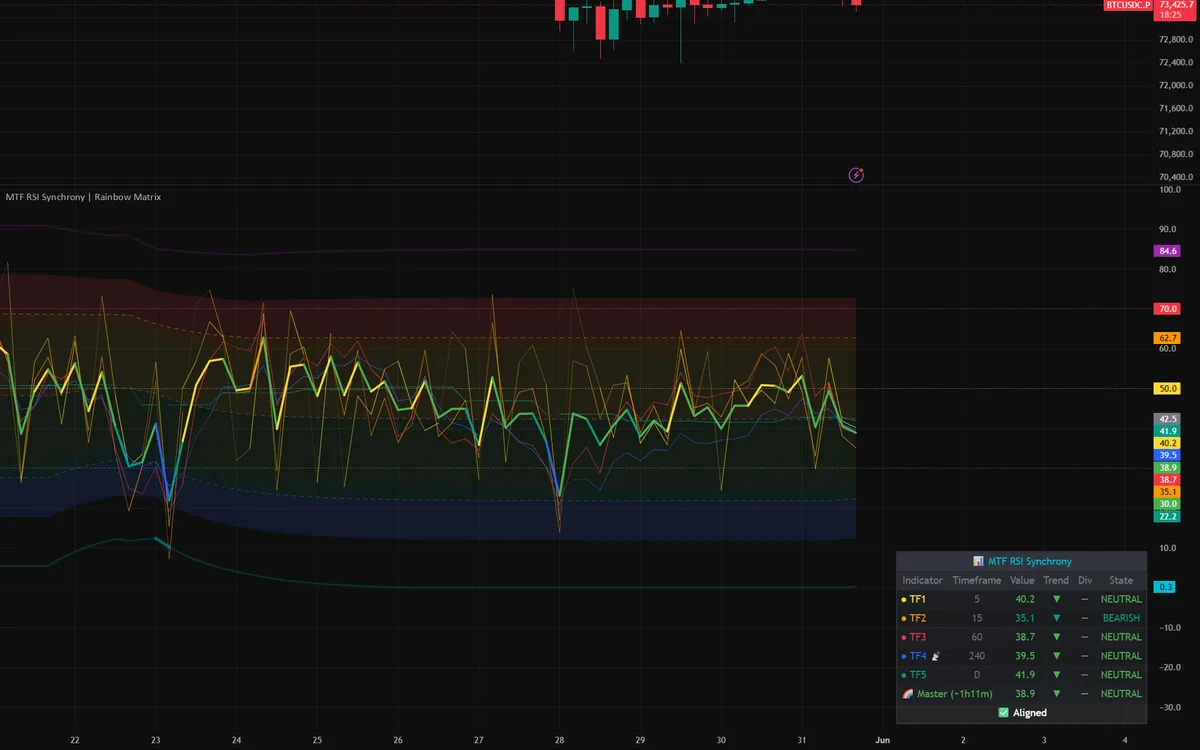
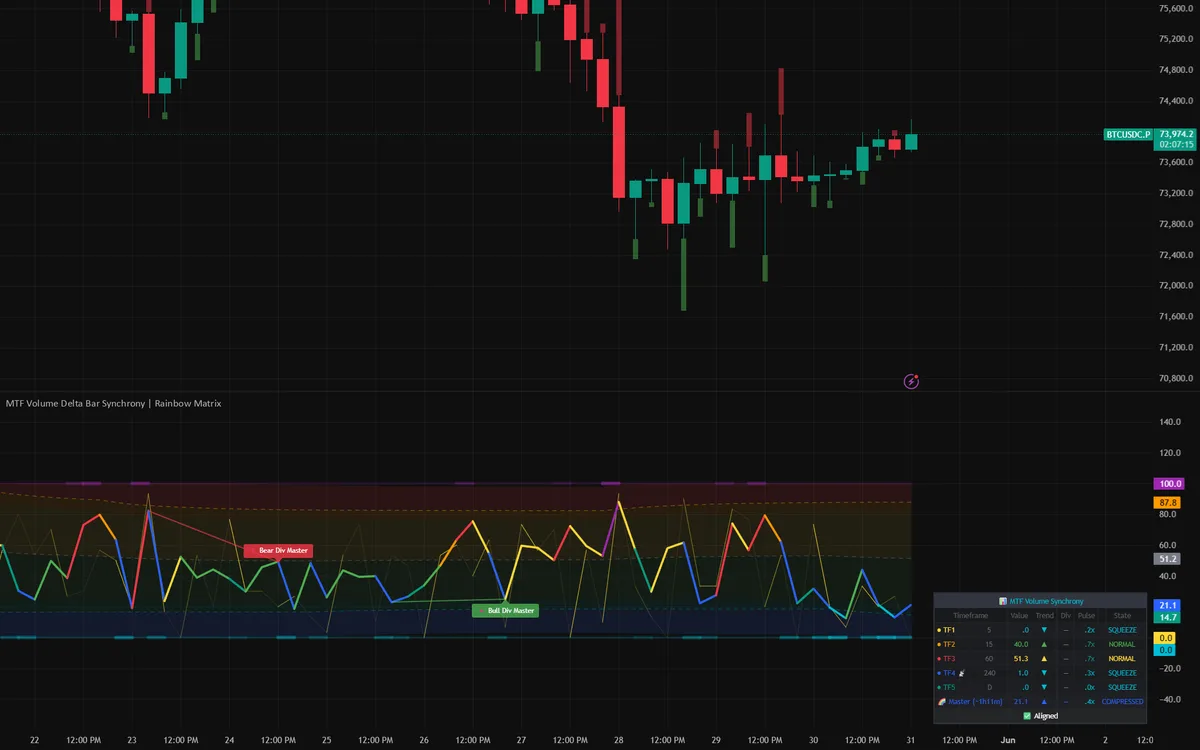
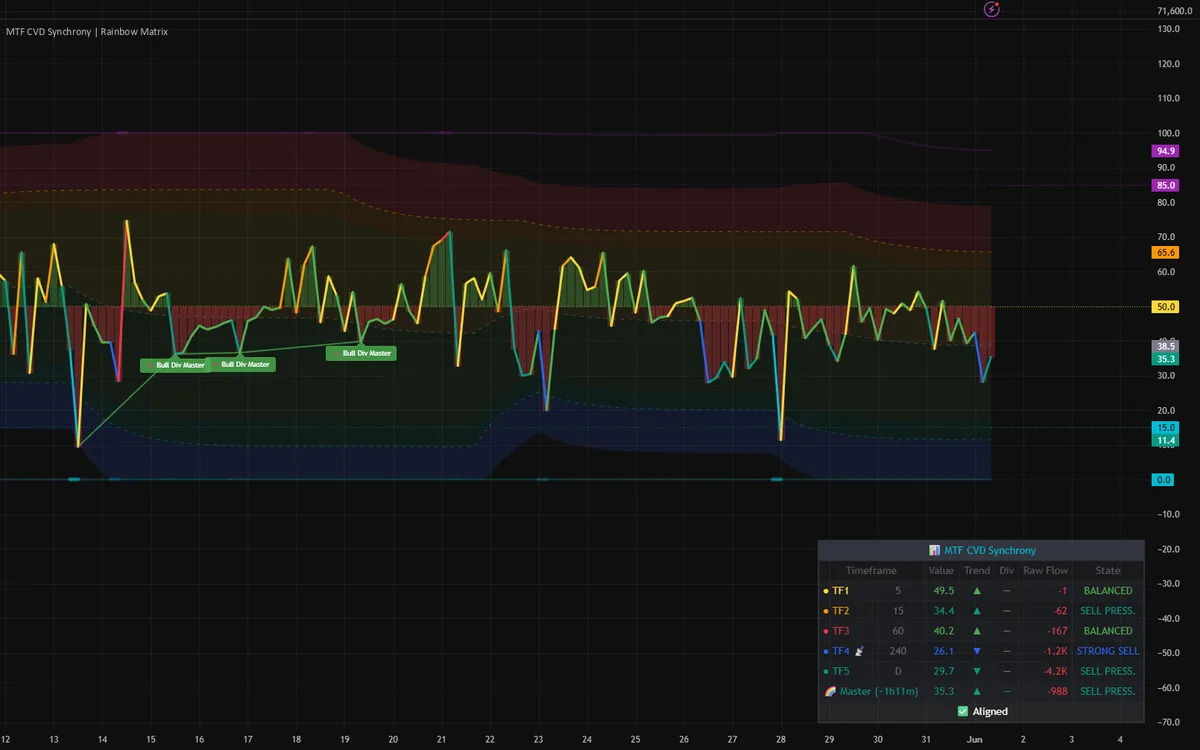
📈 MTF Kinetic Oscillator
Multi-timeframe order-flow probability oscillator. Fuses 5 timeframes via Fibonacci weights, modulated by CVD / Climax / Squeeze sensors against a self-adaptive Fibonacci channel.
- ✓ 5-TF fusion (Fib weights 0.15/0.20/0.25/0.25/0.15)
- ✓ Log-Normal Z-Score + RSI per timeframe
- ✓ CVD / Volume Climax / Squeeze sensors
- ✓ Adaptive Fibonacci channel + Vacuum Trail
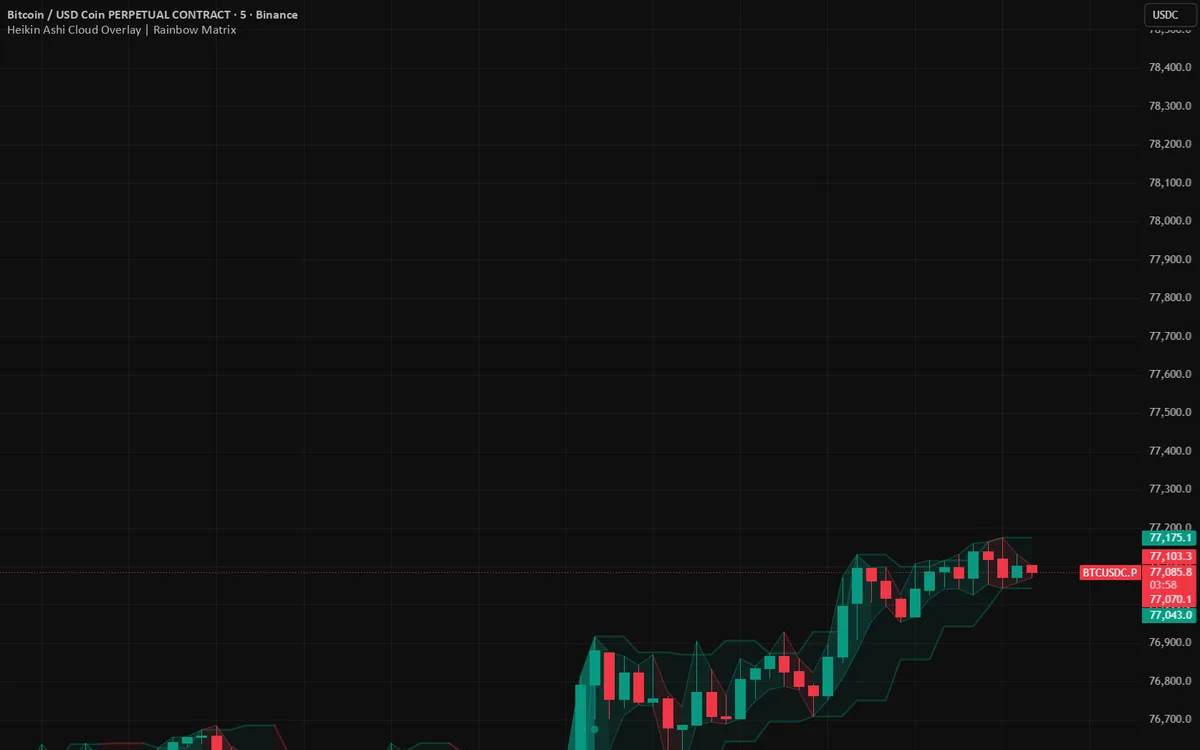
🔵 Heikin Ashi Cloud Overlay
A Heikin Ashi cloud rendered on top of real candles — smoothed trend context plus precise entry-bar timing in a single view, with body-intensity opacity and anomaly markers.
- ✓ HA cloud over real candlesticks (dual view)
- ✓ Body-intensity opacity (momentum density)
- ✓ Body anomaly markers (>3× rolling avg)
- ✓ HA State HUD + 3 alerts